Dr James Park gets to grips with groups
One common method used by archers to try to fine tune their equipment is to watch their group sizes. The method is typically something like:
- Shoot a few ends (typically from one to three) and measure the group width (outside arrow to outside arrow).
- Make a small adjustment to the bow (for example, add a click to the pressure button spring tension).
- Shoot a few ends and measure the group width again.
- If the group got smaller after the adjustment, that is good, so make another adjustment in the same direction. If the group got larger, adjust in the other direction.
- Repeat until the optimum adjustment is found.
There seems to be a few different ways to make the measurements. For example, I have seen archers try to do this using the length of string it takes to go around the circumference of the group. I have also seen archers do that, but exclude the outermost arrows in the group.
While I have seen archers try to use this method over perhaps the past 25 years, I have never been comfortable that it gave good results. I recently took the time to run a full statistical analysis of the method.
An archer’s arrows are normally distributed both horizontally and vertically. Hopefully, the group is centred on the centre of the target. The standard deviation of the distribution (in effect, a measure of the group width or height) depends on the archer’s skill level.
For example, for an archer with an average score of 600 for a 70m ranking round, the standard deviation will be 107mm. Virtually all the archer’s arrows can then be expected to be within ±3 standard deviations of the group centre.
When an archer shoots a group of, say, six arrows, the width and height of the group will also be normally distributed. The width and height of the group will have a mean of 2.53 times the above standard deviation, and the standard deviation of the width and height will be 0.334 of the mean group width. That means that even if no changes have been made to the bow tuning, the group width and height will still vary quite a lot from end to end.
This means that the usual variation in the group width or height from end to end very strongly masks any change in the average group width or height resulting from a small change to the equipment.
For part of my analysis, I asked seven archers to measure the width and height of 24 six-arrow ends. These archers were all national team or national training squad members. I did not tell them what I was analysing, as I did not want to introduce any bias into the results.
I simply asked them not to make any sight adjustments during an end, and to carefully measure the height and width of each end on a day of good shooting conditions. I then tested the measurements to see if they were normally distributed. They were – and very close to the values expected from the mathematics. This is a test you could try yourselves.
The widths (in mm) of each group for one of the archers (a compounder with typical ranking round scores of mid 690s) were as follows: 107, 65, 100, 44, 70, 91, 53, 46, 56, 97, 115, 84, 115, 101, 87, 62, 93, 64, 51, 51, 117, 50, 138 and 120. The variation in group width from end to end is obvious. Remember, this variation was happening (as expected from the mathematics) even though the archer made no changes at all to his equipment during the testing.
Any good test needs to have a high probability of true positives and true negatives rather than false positives and false negatives. Typically, good science requires a probability of something like a 0.95 probability of true positives and true negatives.
If we back that off to a very weak test with a probability of 0.8, we still need a fine-tuning adjustment to make a very substantial (and unrealistic) change to the archer’s average score, even if the average size for 10 ends is used.
Using a base score of 600 and a required probability of at least 0.9, a technique or equipment change would need to yield an additional 58 points on average for a 72-arrow ranking round for a two-end test to be satisfactory.
A four-end test could be used if the change yielded 43 points; a 10-end test could be used if the change yielded 29 points; a 20-end test could be used if the change yielded 21 points; and a 100-end test could be used if the change yielded 10 points. A 200-end test would be necessary if the change yielded seven points on average. That is a lot of ends.
Given the magnitude of the score changes expected from small equipment adjustments (such as a small change in the pressure button spring tension), the test using five or fewer ends would provide similar confidence to a coin toss (which would be easier and faster, and need not involve the archer).
Nevertheless, when using these tests, archers can be expected to see a difference in group sizes from end to end simply due to the group size standard deviation. They may think that an improvement has been obtained and that the test is viable, but it will not be repeatable.
A better approach is to simply monitor the archer’s average score after making a change. This needs to be done over an extended period – a day or so will not be sufficient to get statistically significant results. Typically, several hundred to 1,000 shots will be necessary.
A good way to do it is to use an application such as Artemis. All the archer then needs to do is score normally to gather the required data – no measurements of the group sizes are required, only the score.
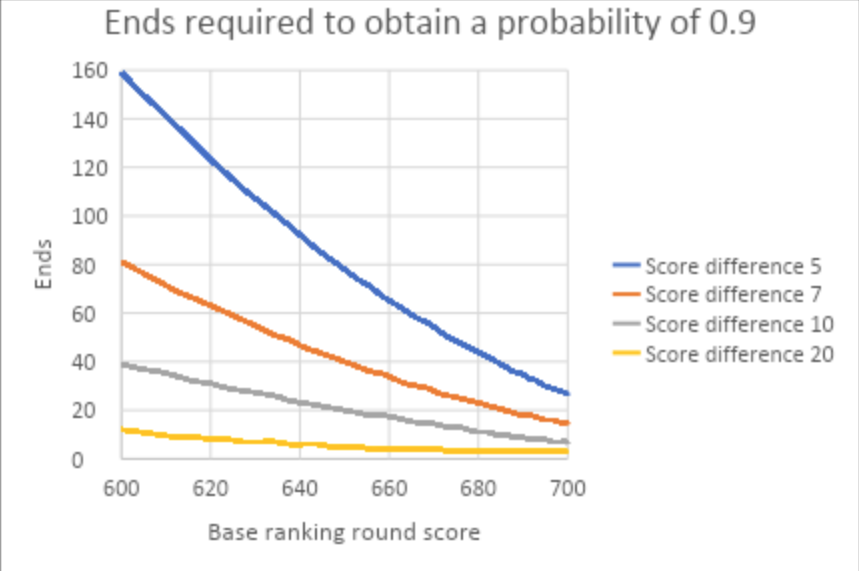
The figure (above) shows the number of ends required to obtain a probability of 0.9 for a given score improvement over a base ranking round score. For example, if the average score prior to a change was 640 and the average score after the change was 647, an average of at least 43 ends would be required to obtain a probability of 0.9.
A very small number of points can make a substantial difference to an archer’s ranking and probability of winning a medal at a major international event. In many cases, it is necessary for the archer and coach to simply trust the mathematics and physics underlying a change.
You can find my analysis in my recently published paper:
Park, J L, Using group sizes to optimise archery equipment, Proc IMechE, Part P: J Sports Engineering and Technology, 2021; 228(4): DOI: 10.1177/17543371211053716


This is really great. I really appreciate the use of math and statistics in the analysis of archery.
I do have a question, would there be a degree of change to help make a determination in which direction a change may need to be made with fewer arrows? For example, if I change my plunger tension by +/- 2 full turns, how many arrows would I need to determine if the change is the right direction. Or is there a non-linear response that would confound those results?
Hi Will – I will try and get an answer for this for our next experts column! Thanks